
Page 33 - Demo
P. 33
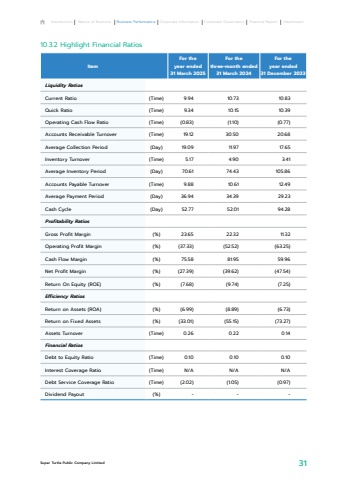
Super Turtle Public Company Limited 3110.3.2 Highlight Financial RatiosItemFor the year ended31 March 2025For the three-month ended31 March 2024For the year ended31 December 2023Liquidity RatiosCurrent Ratio (Time) 9.94 10.73 10.83Quick Ratio (Time) 9.34 10.15 10.39Operating Cash Flow Ratio (Time) (0.83) (1.10) (0.77)Accounts Receivable Turnover (Time) 19.12 30.50 20.68Average Collection Period (Day) 19.09 11.97 17.65Inventory Turnover (Time) 5.17 4.90 3.41Average Inventory Period (Day) 70.61 74.43 105.86Accounts Payable Turnover (Time) 9.88 10.61 12.49Average Payment Period (Day) 36.94 34.39 29.23Cash Cycle (Day) 52.77 52.01 94.28Profitability Ratios Gross Profit Margin (%) 23.65 22.32 11.32Operating Profit Margin (%) (37.33) (52.52) (63.25)Cash Flow Margin (%) 75.58 81.95 59.96Net Profit Margin (%) (27.39) (39.62) (47.54)Return On Equity (ROE) (%) (7.68) (9.74) (7.25)Efficiency RatiosReturn on Assets (ROA) (%) (6.99) (8.89) (6.73)Return on Fixed Assets (%) (33.01) (55.15) (73.27)Assets Turnover (Time) 0.26 0.22 0.14Financial RatiosDebt to Equity Ratio (Time) 0.10 0.10 0.10Interest Coverage Ratio (Time) N/A N/A N/ADebt Service Coverage Ratio (Time) (2.02) (1.05) (0.97)Dividend Payout (%) - - -Introduction Nature of Business Business Performance Corporate Information Corporate Governance Financial Report Attachment
